Holographic MEMS Analyzer
Explore the wealth of 4D
The holographic MEMS analyzer solution provides time sequences of the successive 3D topographies of a MEMS along its driving signal. This unique set of data contains an unrivalled wealth of information. In particular, in- and out-of-plane displacements and frequency response can be analyzed at any location within the measurement field of view.
- A non-scanning method for reduced characterization time
- Efficient comparison between simulations and micro-manufactured devices
- Measurement of samples that cannot be characterized with other techniques.
Record time-sequence of 3D topographies up to 25 MHz


A Unique set of Data
for MEMS Analysis


A COMPLETE SOLUTION FROM MEASUREMENTS …
The Lyncée Tec holographic MEMS analyzer includes a complete characterization environment including:
- Platforms for sample probing
- Vacuum and thermal chambers
- Signal generator for MEMS with excitation up to 25 MHz
- Recording of electrical response
- DHM® T and R series for the 3D topography time sequence acquisition
- Stroboscopic unit for measurement and MEMS excitation synchronization

… TO TIME SEQUENCE ANALYSIS
The MEMSTool software enables efficient analysis of 3D topography time-sequences in term of
- Out-of-plane displacement from 5 pm to 50 microns
- In-plane displacement from 1 nm (sub-pixel algorithms) to 5 mm
- Bode and Fourier frequency response analysis
- Vibration maps

Interact with your sample
Users Testimonials
University Autonome of Barcelona
An international team of researchers from Spain, the Netherlands, and USA have characterized the flexoelectric coefficient of dielectric materials on silicon by measuring the bending radius induced on application of voltage, with the DHM®. Nature publication

The DHM, unlike a vibrometer, directly measures the out of plane displacement induced at each point of a MEMS structure during a vibrational excitation .
Thus, the DHM data lends itself elegantly to harmonic analysis via the application of discrete Fourier transform techniques. The latter is indispensable to distinguish between a response that scales linearly with the applied electric field (for example, piezoelectric strains) and a response that scales quadratically with the applied electric field (for example, electrostictive strains).
FHG-IPMS in Dresden, and TU Cottbus Senftenberg
German researchers from FHG-IPMS in Dresden, and TU Cottbus Senftenberg have measured the deflection of a revolutionary micro-actuator technology using DHM® (IPMS-FHG press release). Nature publication, Electronic Component News

We can work with any dynamics we want (stroboscopic and continuous measurement) – that makes the DMH unique to alternative tools (WLI and Laser-Doppler-Vibrometer).
It gives the high vertical resolution to precisely characterize the actuator out of plane deflection
A vibrometer measures a velocity using the Doppler effect: tip deflection is calculated by an integration. Consequently, position measurement errors are also integrated, preventing absolute prosition and long term drift measurements.
DHM® doesn’t suffer from this problem as it measures directly a position. Deflection can be measured accurately for any time scale.
Holographic MEMS Analyzer
The Holographic MEMS Analyzer solution encompasses all the options to provide you with a complete environment for MEMS characterization. The system responds to most users characterization needs, however if something is missing, Lyncée Tec is also pleased to provide you with turnkey customized solutions.
Probing
MEMS probing platforms enable direct DHM® characterization of devices without wire-bonding. A heated version enables the investigation of the effects on MEMS responses of temperatures up to 200°C.
Vacuum and temperature control
Vacuum & thermal chambers enable characterization of devices in real conditions of use, e.g. vacuum, liquids, gas, high and low temperature, down to 196°C, high pressure, etc. Measurements are as simple as in ambient conditions thanks to DHM® unique optical configuration.
Holographic Microscopes
Reflection and transmission DHM® with one and two wavelengths are fully compatible with the Holographic MEMS Analyzer solution. They can be configured with any objective, including long working distances, immersion, and glass corrected models, for measuring in presence of probes, in liquid, and through transparent covers respectively.
Stroboscopic Module
The stroboscopic unit synchronizes the MEMS excitation with the 3D topography time sequence and electrical response measurements. is recorded to get 3D topographies time sequences along the excitation of the MEMS, vibration and electrical information in a single data set with one system.
Post-analysis software
The MEMS Analysis Tool software enables movement decomposition in terms of tilt, deformation, in- and out-of-plane displacements. Vibration amplitude, speed and acceleration at any location of the sample can then be calculated. Moreover, this software enables resonance, Fourier, and Bode frequency analysis.
Competitive strengths
Holographic MEMS Analyzer overcomes limitations of usual MEMS analyzers. It is the only solution able to synchronize MEMS excitation and 3D topography measurement at frequencies up to 25 MHz. Moreover, it is ideal to measure in any environmental condition. Alternative systems are :
Holographic MEMS Analyzer vs Laser Doppler Vibrometer (LDV & 3D LDV)
The main difference between both systems is that the DHM® retrieves simultaneously data points on each pixel on the entire field of view while LDV scans the surface point by point. Therefore LDV lateral resolution is limited by the spot size (few microns). With DHM® you can select the lateral resolution adapted to your sample by choosing the appropriated objective. LDV has to perform a complex chain of signal processing steps to measure a velocity. Each data point is then converted in term of vibration amplitude. LDV alone does not provide an absolute position and thus no 3D topography. DHM® measures a time sequence of successive 3D topographies what enables direct calculation of absolute position, speed and acceleration. Vibrations amplitude can be determine with high reliability by DHM®.
| Features | DHM® | 3D LDV | LDV |
| Dynamic topography | |||
| 3D vibrations (X,Y,Z) | XYZ | XYZ | Z only |
| Maximum frequency | 25 MHz | 25 MHz | up to 1.2 GHz |
| Full field measurement | with XY scanning | with XY scanning | |
| Diffraction limited resolution | limited by laser spot size | limited by laser spot size | |
| Objective turret | |||
| No need of sample preparation | – diffusive sample required | ||
| Measurement of complex structures | |||
| Measurement of complex motions (simultaneous in-, out- of plane, tilt, … ) | ++ | – | – |
| Measurement of in-plane displacement lager than MEMS structures |
Holographic MEMS Analyzer vs 2D Stroboscopic Microscopy
2D stroboscopic microscope is usually combined with LDV to add in-plane displacement measurement capabilities to vibrometer.
| Features | DHM® | 2D Stroboscopic Microscopy |
| 3D topography | ||
| 3D vibrations (X,Y,Z) | 1 | |
| Maximum frequency | 25 MHz | 1 MHz |
| Full field measurement |
Holographic MEMS Analyzer vs White Light Interferometer (WLI)
Some white light interferometers can perform a stroboscopic acquisition to measure MEMS dynamic topography. However, measurements of dynamic sample with a scanning technology are sensitive to environmental noise, i.e. vibrations, and are time consuming. Some systems combine white light interferometer with LDV or 2D stroboscopic acquisition in order to measure a static topography. In this case measurements of topography in environmental chamber face usual limitations of WLI technology.
| Features | DHM® | WLI |
| Dynamic topography | –1 | |
| 3D vibrations (X,Y,Z) | –1 | |
| Maximum frequency | 25 MHz | 1 MHz |
| Stitching measurement | not in stroboscopic mode | |
| Measurement in environmental chamber | –2 |
1. WLI are usually used for static topography. Scanning technologies are not adapted to dynamic measurement 2. Limited choice of objective with window (glass) compensation
Specifications
| Optical measurement unit | Reflection DHM® or Transmission DHM® |
| MEMS excitation unit | LyncéeTec stroboscopic module |
| XYZ stage | Manual or motorized stage |
| Software | Koala for acquisition and live analysis MEMS Analysis Tool for advanced post-analysis |
| Objective | Turret with 6 positions, magnification from 2.5x to 100x |
| In-plane vibration2 | from 10 nm to 5 mm |
| Vibration resolution2 | down to pm |
| Topography resolution | Vertical : 0.3 nm Lateral1 : from 400nm to 8.5μm |
| Normalized Floor Noise NFN | Out-of-plane : 624 pm · Sqrt(# sampling) |
| Excitation frequency | from static to 25 Mhz |
| Laser pulse length | down to 7.5 ns |
| Max vertical velocity2 | up to 10 m/s |
1. equivalent to vibrometer spot size, objective dependent
2. specification does not depend on excitation frequency. See here below
Vibrometry and DHM stroboscopic measurements
The 4D capability of DHM offers multiple benefits especially for dynamic measurements. In the context of MEMS analysis, the DHM measurements can be translated into vibration maps, which provide a synthetic view of the amount of vibration that occurs at each measured pixel.
The noise on a vibration map corresponds to the detection limit of a vibrometric measurement, and can thus be used to characterize the performance of a system.
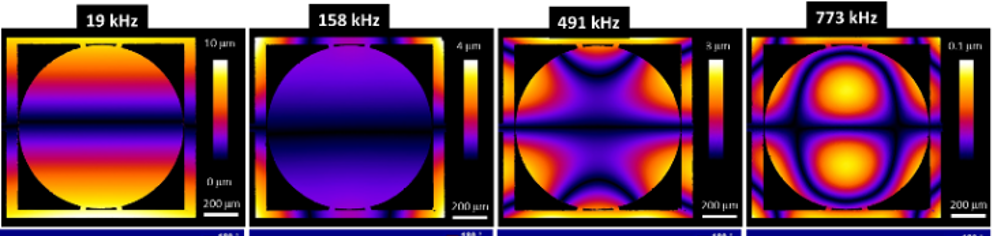
DHM vibration amplitude maps floor noise definition and measurement
DHMs provide raw data that differs from Laser Doppler Vibrometry (LDV). Indeed, DHM directly provides time sequences of topographies and absolute vibrations amplitudes, with units in picometers
LDVs measure a speed. Its output results from a FFT and a power spectrum. Consequently, Floor Noise and displacements are usually expressed in function of the measurement bandwidth, with units in picometer/Sqrt(Hz). To calculate its absolute displacements and noise level from such specifications, it must be multiplied by the measurement bandwidth, generally small at low frequency, and large at high frequency.
To allow for comparison a presents a rigorous methodology based on fundamental noise definitions to specify the out-of-plane vibration floor level. The effect of all significant experimental parameters on the minimum detection level is evaluated, and the optimization of each of them discussed.
Summary of publication results
DHM MEMS analyzers are characterized by their Absolute Floor Noise (AFN) expressed in picometers, that
decreases as the square root of the
- Number of sample per period
- Number of period averaged
- Area in pixel of the topographic data filtering kernel
does not depend significantly on the following experimental factors:
- MEMS excitation frequency
- Selected objective
- Duty cycle, i.e. laser pulse duration relative to the MEMS excitation period
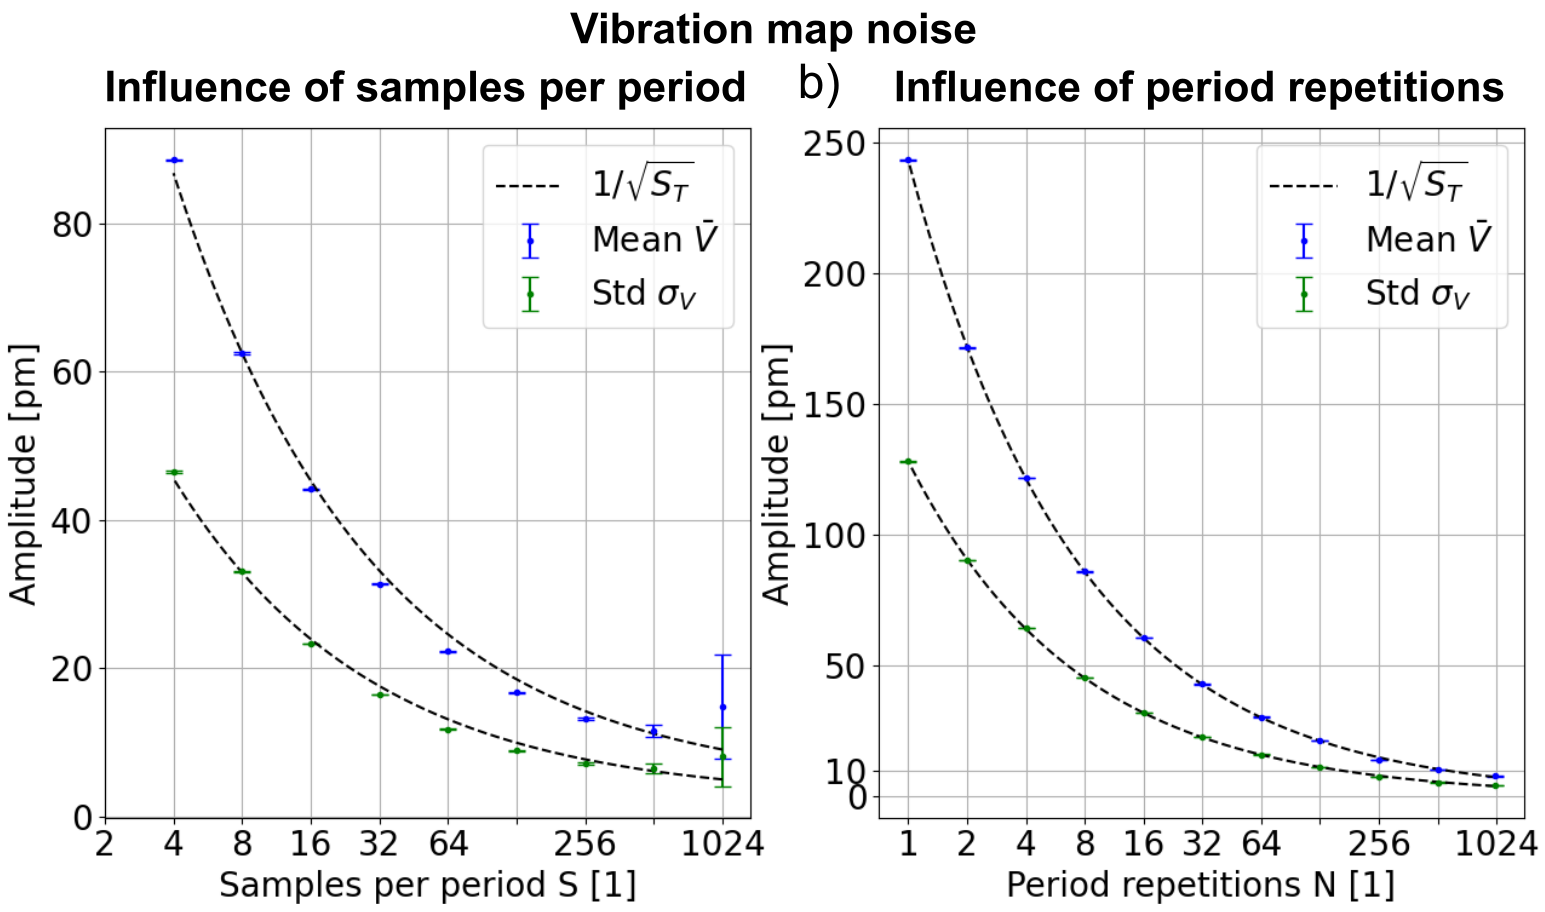
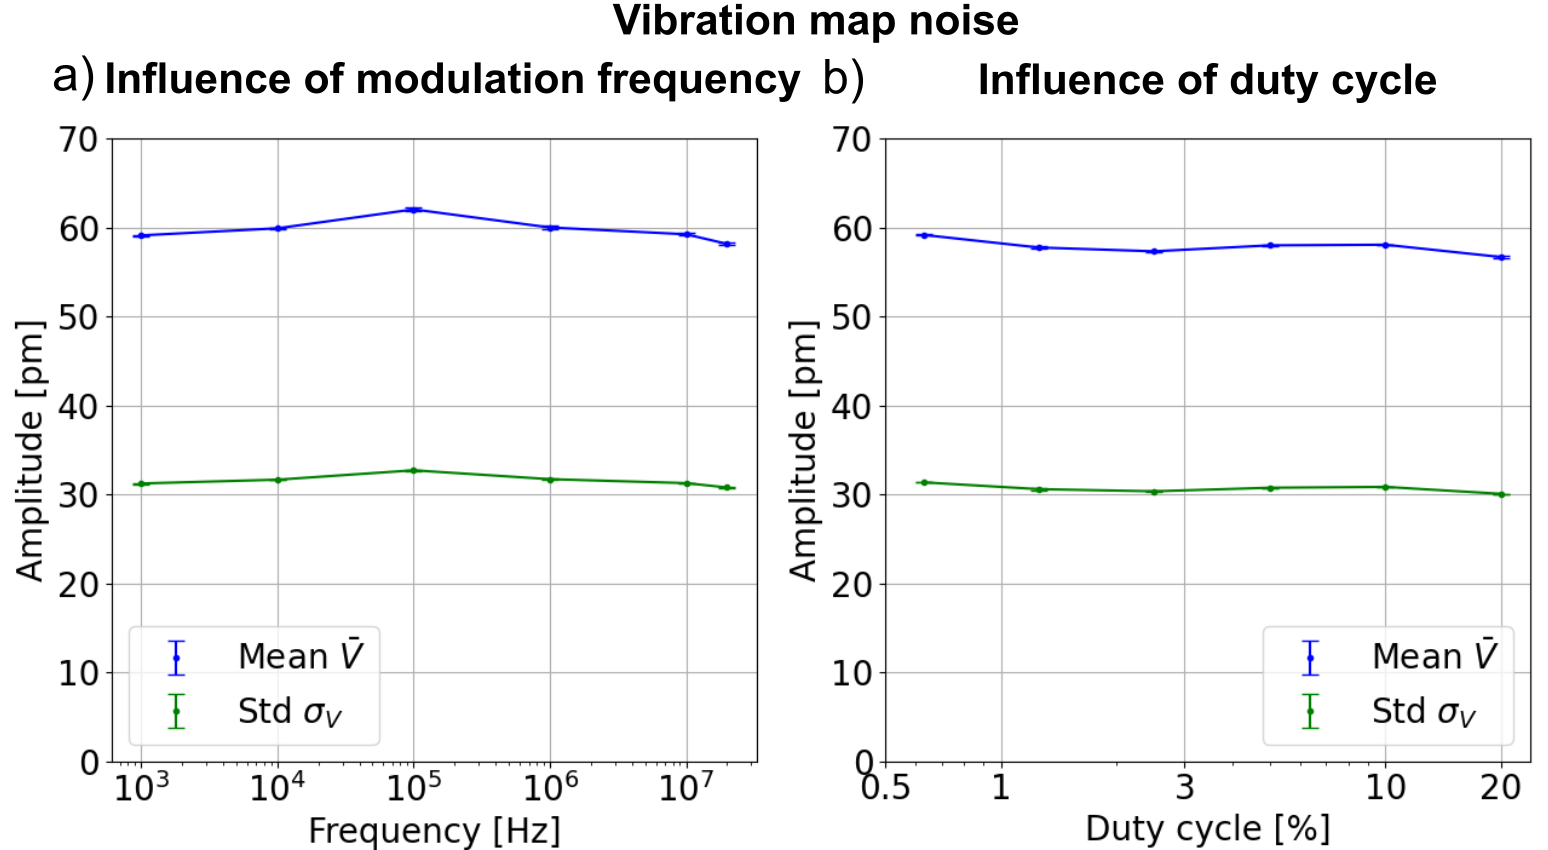
DHM Actual Floor Noise (AFN) Definitions and measurement
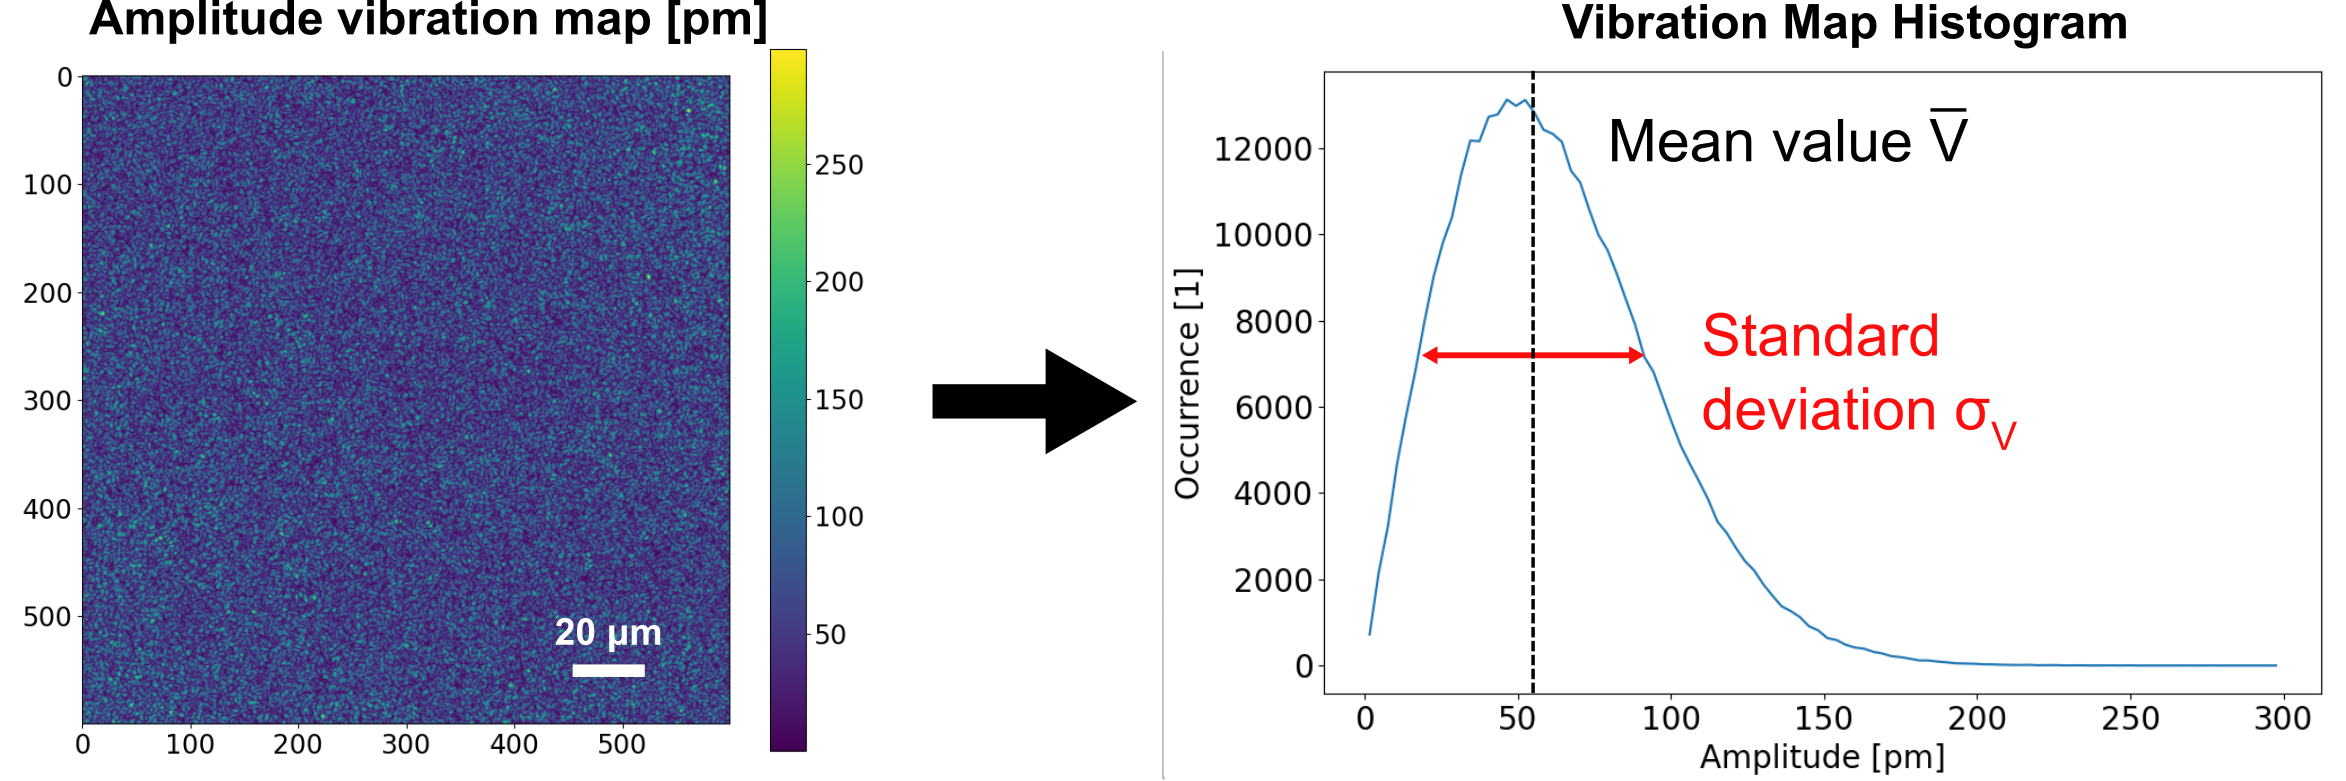
To quantify the performance of a DHM MEMS analyzer, the vibration amplitude map of a flat calibration mirror—assumed to be static—is measured. Without noise, such a map should be identically zero. Given that this is a real-world system, and considering the inevitable environmental disturbances, that is not the case. Noise is therefore characterized using two parameters:
- The standard deviation σv of the amplitude map, that measures the dispersion of the measured vibration amplitudes around the expected value.
- The mean value of the amplitude map, enabling to determine the so-called Actual Floor Noise (AFN), i.e. the vibration amplitude corresponding to a signal to noise ratio (SNR) of 1.
DHM Normalized Floor Noise (NFN)
As the dependance of the AFN is essentially a decrease as the square root of the sampling, a generic value of merit for a system performance, independent of experimental parameters can be defined: the Normalized FN (NFN) = AFN ∙ Sqrt(#sampling).
It represents the noise for the unrealistic theoretical case of a sampling of 1, which is a not a value directly measurable, as it is impossible to perform stroboscopic measurements with periodic excitation with only one data point per cycle. The unit of NFN is pm ∙ Sqrt(#Sampling).
For a system previously characterized by its NFN, AFN can be used as a predictive value, before measurements, to determine the required sampling for achieving an expected noise performance.
Unlike FN used for LDVs, NFN and AFN are independent of the measurement bandwidth.
DHM and LDV Floor noise comparison versus sampling and frequency
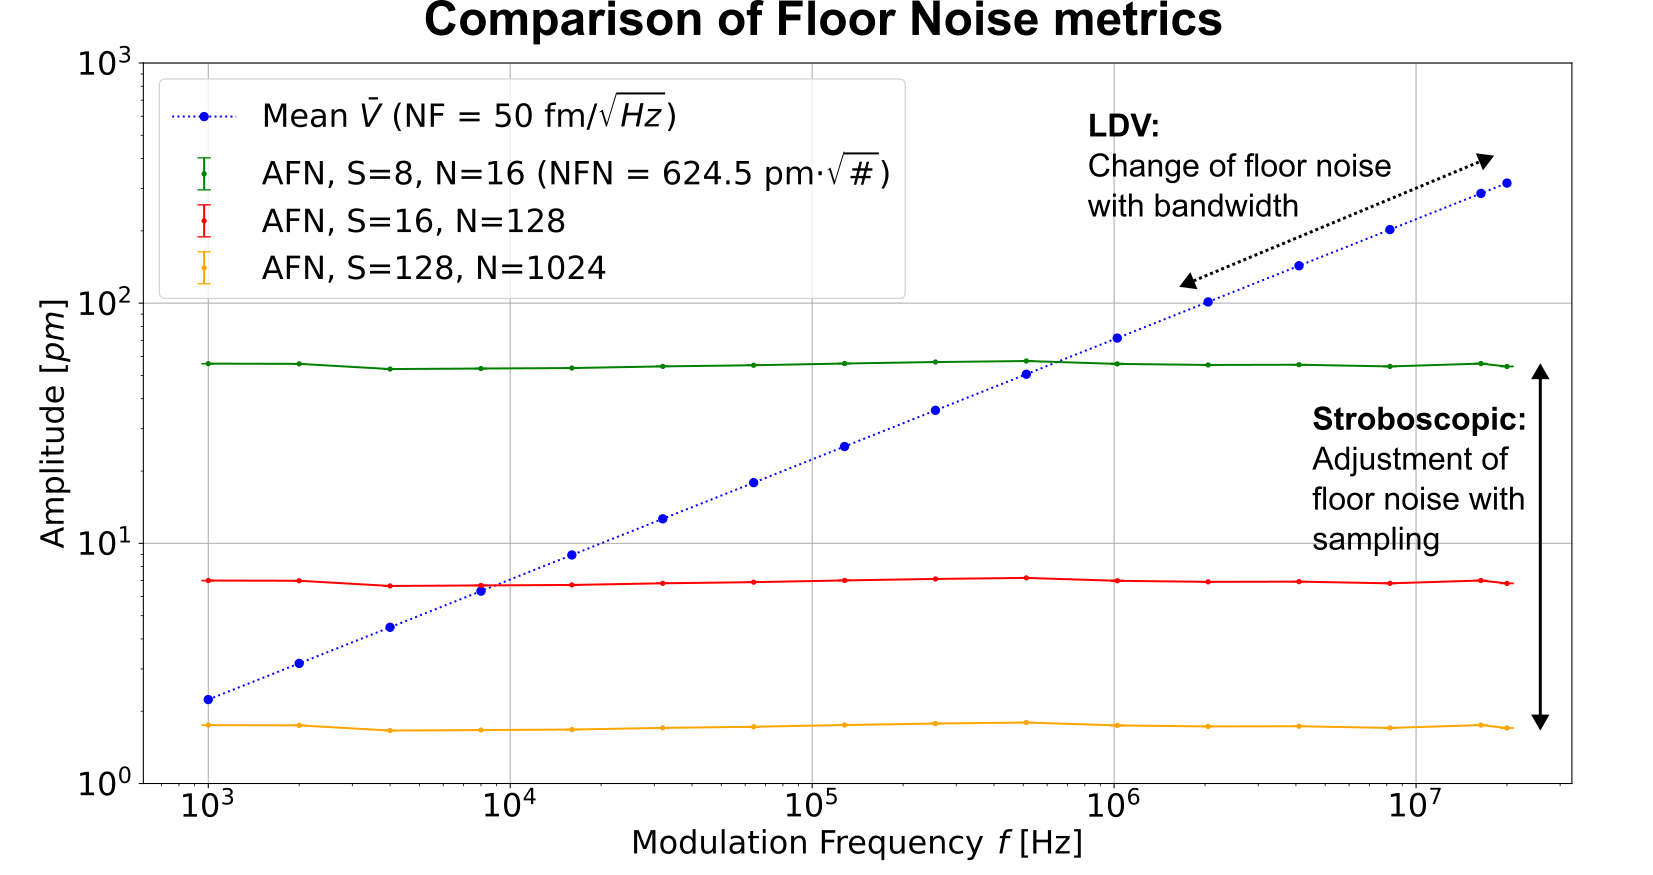
The left figurer shows resulting AFN for typical Sampling values and NFN = 624.5 pm. AFN independence on frequency is clear. This graph also illustrates how the target noise floor can be reached by adjusting sampling values.
In comparison, assuming a state of the art LDV with a FN of 50 fm ∙ Sqrt(Hz) and an ideal bandwidth of Nyquist frequency (2 times the modulation frequency), the graph shows that the LDV Actual Floor Noise in picometers increases nonlinearly with higher frequencies and cannot reach DHM AFN.
Picometer scale vibration mode of a Phononic Crystal
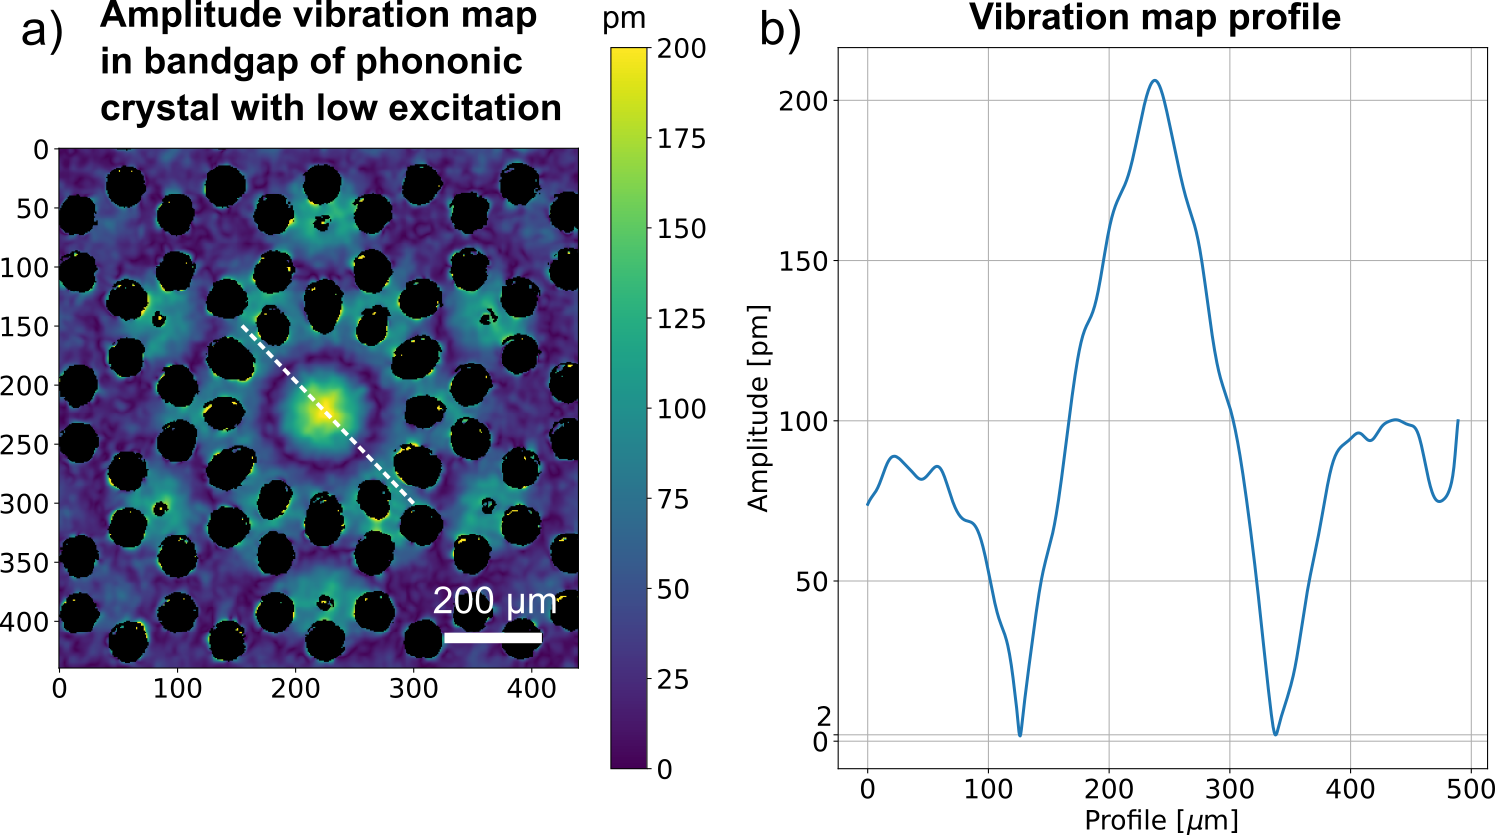
Results here above are validated by measuring the vibration mode of a Phononic Crystal (PnC), requiring a detection level of one picometer.
The PnC was placed in a vacuum chamber and excited at a specific resonance frequency (f = 1.2675 MHz) and small amplitude to minimize the magnitude of displacement. Measurements were performed with a R1000 system (λ = 666 nm, M = 2.5x NA = 0.07), and a total sampling of 32’768. A spatial filter is used to reduce noise before computing the vibration map, yielding an optical lateral resolution of approximately 20 μm. Based on these parameters and assuming a similar NFN of 625 pm ∙ Sqrt(Hz), noise levels in the order of 0.86 pm could be expected.
Regions of minimum and small displacement can be identified on the amplitude vibration map of this resonance mode displayed in the right figure. It is possible to see that the lowest vibration measured on the corresponding profile, corresponding to a resonance node is 1.26 pm, which is on the same order of the expected noise value. It is interesting to reach these low noise levels on such a sample, as even with low excitation, it vibrates at the center with amplitudes up to 100 times higher than the noise level.
Lyncée Tec Challenge 2022
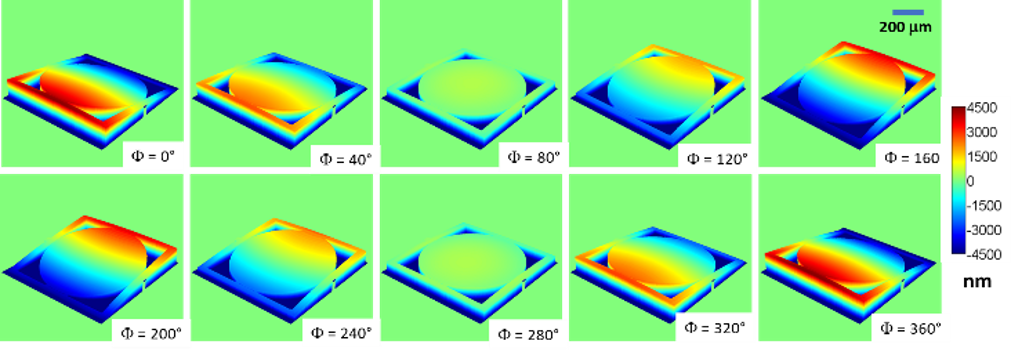
Lyncée Tec Challenge 2022 was successfully launched in May 2022 to call for the best MEMS application which demonstrates the DHM® unique strengths for vibration map measurements. The winner receives a DHM® holographic MEMS analyzer as their prize! After more than 6 months, Silicon Austria Labs SAL won this award for their outstanding and innovative demonstration of measuring dynamic deformations of MEMS mirrors at all scanning angles using DHM’s unique full field vibration mode shape analysis. Congratulations to the winner and to all participants!
For more details, please visit webpage: https://challenge.lynceetec.com/
Among all applications, 5 best measurements are shown below.
- Description: Dynamic deformation of a MEMS mirror during the full scanning cycle and the corresponding point spread function
- Sample: MEMS micromirror
- Courtesy of: Dr. Clement Fleury, Silicon Austria Labs, Austria

- Description: Vibration mode shapes vs. FEM simulation
- Sample: X-ray detector array with bismuth absorbers coating for space telescopes
- Courtesy of: Dr. Henk van Weers, SRON, Netherlands Institute for Space Research, Netherlands

- Description: Vibration amplitude maps with frequency continuous sweep:640-670 kHz, showing complex mode shapes
- Sample: Nano-Micro cantilever with increased sensitivity
- Courtesy of: Prof. Dr.-Ing. Julia Körner, Leibniz University Hannover, Germany

- Description: Deformed structure requires decorrelation of in- & out of plane vibration for true value
- Sample: Tunable ring resonator
- Courtesy of: Dr. Mathieu Gratuze, Ecole de Technologie Superieure, Canada

- Description: Complex structures and complex in- & out-of-plane vibration mode shapes
- Sample: Double side clamped beam
- Courtesy of: Dr. Daniel Moreno, Ecole polytechnique fédérale de lausanne EPFL, Switzerland


